|
|
|
|
Ventilation Energy Savings
While Maintaining
Premium Air Quality
Intelligent air quality
Adults consume two to three liters of liquids and one to two kilograms
of food per day. While hygiene and safety of edibles receive great
attention, air quality gets very little even though on average we inhale
15 kg of air per day — 80% of which indoors. From the classroom to the cubicle, the benefits of maintaining good
indoor air quality extend beyond protecting the occupants’ health. Students in schools with healthy air are more proficient at retaining
information and teachers have fewer sick days.
For employers, studies
show that improving indoor air quality directly correlates with higher
productivity and a more satisfied workforce.
Moreover, the advent of
“green buildings” and emission-dependent energy taxes has created
awareness for both indoor air quality and ventilation energy costs. Consequently, in modern or reconstructed buildings, the alternatives of
either having minimal ventilation with poor air quality on the one hand
or permanent ventilation with high ventilation energy costs on the other
are impractical.
A balance between the two extremes exists in “demand
controlled ventilation” or DCV. This paper is focused on air quality sensors for DCV. It describes
typical indoor air contaminants, their sources, and their impact on
human health.
Moreover, it confronts current indoor air quality
standards with modern ventilation demands and compares today’s
commercially available air quality sensor technologies accordingly.
Finally, suggestions for
improvement of typical ventilation scenarios by using AP:s
intelligent air quality solutions are provided.
Anatomy of Indoor Air
Clean air is comprised of 21% oxygen, 78% nitrogen and 1% argon.
However, indoor environments are different where other noble gases,
carbon monoxide (CO), carbon dioxide (CO2) and volatile organic
compounds (VOCs), also known as mixed gas, exist with different
prominence.
When it comes to the impact on health the latter two are the
most important ones: CO2 for its HVAC (heat, ventilation, and air
conditioning) industry awareness, and VOCs for their criticality.
. . . beyond CO2
The Role and Impact of VOCs in Indoor Air
There are estimated to be 5,000 to 10,000 different VOCs, which are two
to five times more likely to be found indoors than outdoors. Indoor VOCs
are hydrocarbons that originate from two primary sources:
-
bio-effluents, that include odors from human respiration, transpiration
and metabolism
-
vapors generated from building materials and
furnishings.
|
 |
|
|
|
 |
|
VOCs cause eye irritations, headache, drowsiness or
dizziness, and contribute to a condition known as “sick building
syndrome” or SBS, whereby adequate ventilation must be provided.
Aside
from industrial conditions and comfort aspects such as temperature
control, VOCs are the most critical reason to ventilate. Some typical
indoor contaminants and their sources are shown in Table 1.
Clearly, humans represent the greatest source of VOCs, directly and
indirectly; far beyond building materials,
furniture and office equipment, and thereby dominate the demand for
ventilation. |
|
|
|
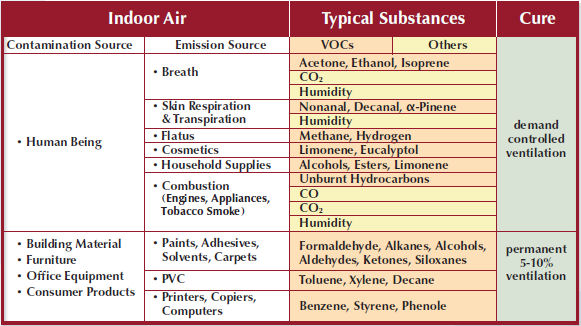
Table 1 - Typical Indoor Air Contaminants (VOCs and others) |
|
|
|
The Role and Impact of CO2 in Indoor Air
Although CO2 is listed twice in Table 1 and plays a major role in modern
ventilation control, it has no permanent effect on humans, especially in
small doses. Exposures on submarines and the International Space Station
confirm that even heavy CO2 concentrations of 1% (10,000ppm)
show no irreversible impact on occupant well-being.
Due to the lack of suitable VOC sensing devices,
CO2 has served historically as an adequate air quality
indicator.
Moreover, since the amount of CO2 is
proportional to the amount of VOCs produced by human respiration and
transpiration (Metabolic Rule) CO2 levels reflect the total
amount of VOCs (TVOCs) as illustrated in Diagram 1.
|
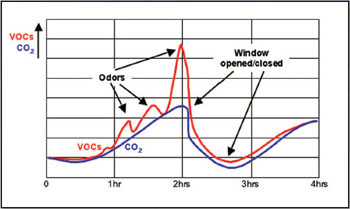
Diagram 1 - CO2 and VOCs from Business Meeting Sessions |
|
Therefore, the ease of targeting CO2
as a single analyte versus thousands of VOCs, combined with the
availability of suitable CO2 measuring technology has made CO2
the surrogate of occupant-generated pollution in indoor environments.
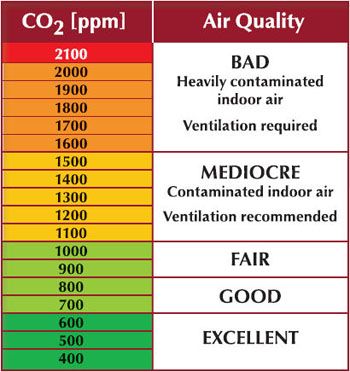
As such, CO2 levels are today’s
standard indoor air quality reference for DCV with tangible air quality
definitions as initially introduced by Max von Pettenkofer and adopted
by most HVAC industry standards. See Table 2.
The Volatility of Volatile Organic Compounds
Diagram 1 illustrates more than just the correlation between
VOCs and CO2. Importantly, the diagram also demonstrates
that VOCs are much more volatile, or sudden in their occurrence.
An increase of human bio-effluents or the
intermittent
use of odorous materials such as cleaning supplies, perfumes or
cigarette smoke is not uncommon. Diagram 1 shows spikes |
 |
|
of these events;
thus, relying exclusively on CO2 as
a ventilation reference will lead to unsatisfactory results.
Ventilation should react on demand toward all
contamination
sources, not only CO2. This points out the weakness of CO2
- based DCV. Detecting a broader range of contaminants optimizes
ventilation energy savings and minimizes the impact on human occupants.
|
|
Indoor Air Quality References From Past to
Present
Historically, CO2 has been the detection gas of choice since
it is a reasonable reference and its detection is fairly easy. Mixed gas
or VOC detectors suffered early criticism due to long-term stability
problems and the inability to calibrate output units.
Further, without suitable threshold values, HVAC
planners using VOC detectors could not easily set ventilation rates and
VOC sensor drift made the entire ventilation system functionally
unpredictable.
Although the motivation to measure the root cause
for contaminated air was appropriate, the implementation was not
successful.
|
|
AP:s Approach — Close to Human
Perception
Taking into account the lack of VOC standards, AP:s iAQ,
intelligent Air Quality, sensor takes advantage of its Reversed
Metabolic Rule technology, RMR. RMR technology calibrates measured VOC
concentrations to CO2 - equivalent ppm-values, thereby
achieving full compatibility to CO2 - standards.
Moreover, the iAQ sensor captures all VOC odor
emissions that are completely invisible to CO2 sensors as Diagram 2
demonstrates.
Importantly, AP:s control algorithms
correct for sensor drift and aging and thereby provide consistency. The
iAQ sensor overcomes deficiencies of CO2 measurement by
detecting the true root-cause of ventilation demand, VOCs.
Further, the iAQ sensor remedies deficiencies of
typical VOC sensing technologies by signal-adherence to established CO2
standards and stringent drift compensation for extended sensor life. The
iAQ sensor emulates the human perception of air quality and even detects
odorless, potentially hazardous substances such as carbon monoxide. |
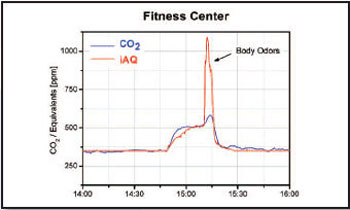
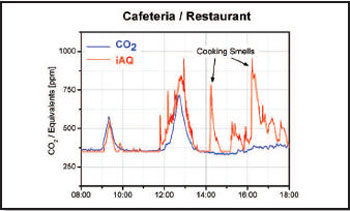
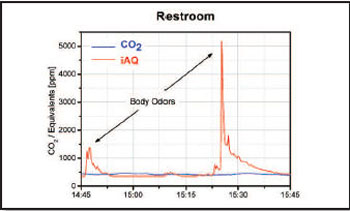
Diagram 2
- Typical scenarios where CO2 sensors fail as DCV reference |
|
|
|
Which Reference to Follow
Today, various types of DCV sensors are available including occupation
detection, CO2 detection, humidity measurement and VOC sensing.
Table 3 compares the performance of the latter
three air quality sensor technologies over various applications, clearly
depicting the advantage of AP:s intelligent Air Quality
technology.
|
|
Application |
COMMERCIAL |
RESIDENTIAL |
| Office |
Conference
Room |
Restaurant |
Gym |
Restroom
Toilet |
Kitchen |
Living-room |
Bedroom |
Bathroom
Shower/Bath |
|
Predominant Event(s) |
breath, odours |
breath, odours |
breath, odours, humidity |
breath, odours |
odours |
breath, humidity |
breath,
odours |
breath, odours |
humidity |
|
Humidity Sensor |
Poor |
Poor |
Fair |
Poor |
Poor |
Fair |
Poor |
Fair |
Excellent |
|
CO2 Sensor |
Good |
Good |
Good |
Fair |
Poor |
Poor |
Good |
Good |
Poor |
|
iAQ Sensor |
Excellent |
Excellent |
Excellent |
Excellent |
Excellent |
Excellent |
Excellent |
Excellent |
Fair |
Table 3 - Performers of various Air Quality Sensors over typical
ventilation scenarios |
|
|
|
When and How to Ventilate
The answer is: On demand. Most VOC events are unpredictable as they are
dominated by human metabolism
and behavior, which accounts for more than 85% of all ventilation cases.
The remainder comes from building material
emissions common in new buildings and after refurbishments or from
furnishings and coatings.
To dilute these emissions sufficiently, low-rate,
permanent ventilation at 5-10% of maximum is adequate.
Table 1 lists relevant substances and recommended
ventilation scenarios. VOC emissions rarely occur in isolation;
therefore, a combination of both ventilation types is the ideal
solution.
More about the BIO
detector´s features and energy saving possibilities |
|
|
|